WHP Information Graphics Making complex information clear, one chart at a time

WHP Information Graphics

Making complex information clear, one chart at a time

Latest Articles

Fiscal Data Visualisation

From Ledger to Headline: Making Council Performance Dashboards Readable in 2026

Council performance dashboards often contain the right figures but hide the story behind equal-weight tiles and technical labels. This practical critique sets out five design moves for 2026, from leading with one accountable metric to publishing a clear update rhythm.
Six Charts, One Household: Making the 2026 Budget Legible Without Distortion
Fiscal Data Visualisation

Six Charts, One Household: Making the 2026 Budget Legible Without Distortion

The November 2026 Budget will arrive with OBR tables, IFS analysis and a blizzard of £ billions. This craft guide sets out six chart forms that translate fiscal totals into human scale without overselling precision, with spreadsheet-ready steps for communicators.

Colour Is Not Decoration: Making UK Charts Readable for Every Eye
Accessibility and Design

Colour Is Not Decoration: Making UK Charts Readable for Every Eye

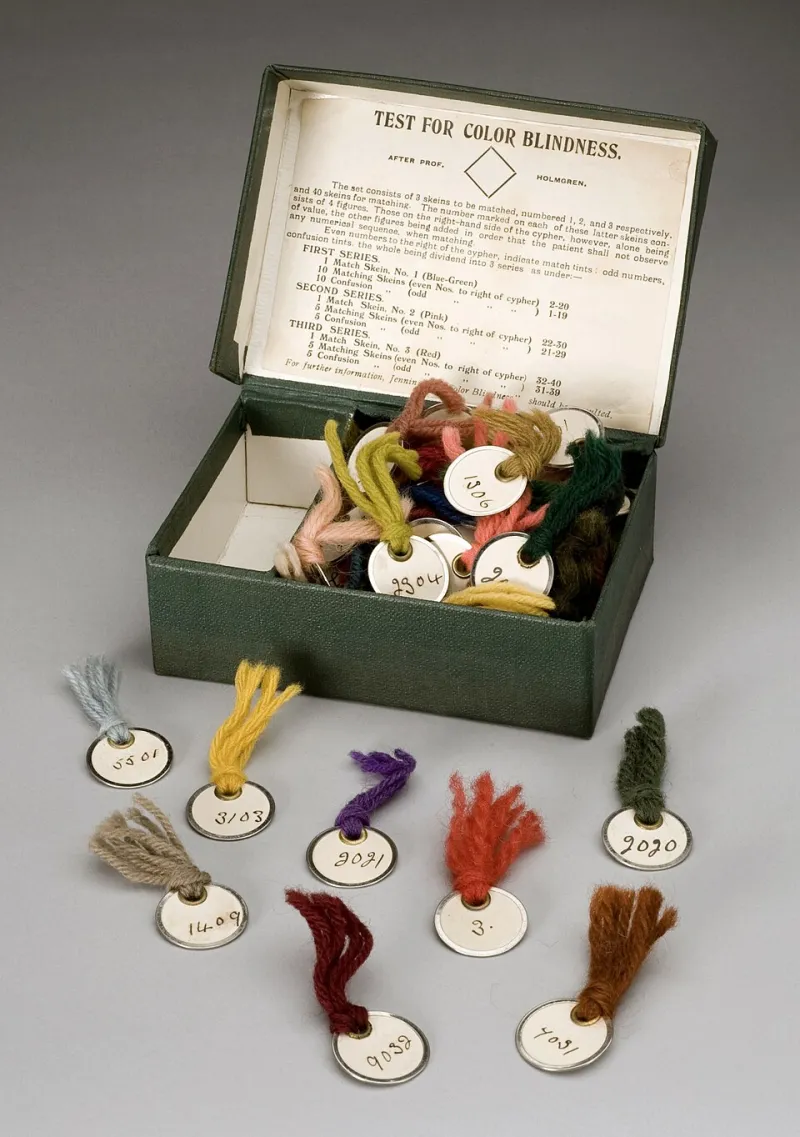
Red-green heatmaps remain common in UK public reporting, yet roughly one in twelve men cannot read them reliably. This pragmatic guide shows how to swap palettes, add redundant labels and meet contrast expectations without losing visual impact.