The Quiet Art of the Queue Board: Visual Lessons from UK Waiting Displays

Photo: Genting Skyworlds Theme Park, Public domain, via Wikimedia Commons
A theme park queue board is not usually discussed as a model of information design. It sits above a ride entrance, shows a number in minutes and changes when the queue moves. Yet it performs a difficult task well: it tells a waiting crowd what to expect, with a single glance, under pressure. The same discipline appears on a rail departure screen and on an NHS waiting-time display. Each is a small public dashboard with a captive audience and no patience for decoration.
For UK public-service designers, these displays offer a useful test. If a dashboard had to work at three metres, in bright light, for someone who is already anxious, what would survive? The answer is rarely more data. It is clearer hierarchy, restrained colour and an honest account of time.
What a queue board gets right
A queue board answers three questions in order: how long, how sure and what now. The wait time is largest. The ride name and status sit beside it. An estimate or a range qualifies the number. A secondary line may point to a single-rider queue or a shorter alternative. The board does not attempt to explain throughput theory. It respects the reader’s immediate question.
Rail departure screens follow a similar logic. The destination and departure time dominate; the platform is prominent; delay information is stated in words as well as colour. NHS waiting-time displays, whether in an emergency department or an outpatient clinic, must do the same while carrying a heavier emotional load. The best examples avoid false precision and tell people what happens next.
Lesson one: hierarchy is a promise
On a queue board, the largest number is a promise about what matters most. In public-service dashboards, that promise is often broken. Twenty indicators receive equal weight, and the reader is left to guess which one is the headline. A better approach is to nominate a ‘headline queue’: the measure the audience came for. For an accident and emergency view, that might be the four-hour performance figure. For a rail screen, it is the next departure. For a council housing dashboard, it might be the number of urgent repairs outstanding.
Hierarchy is not the same as omission. Secondary measures can sit below or behind the headline. But the first visual stop should be deliberate, not accidental.
Lesson two: colour should carry meaning, not mood
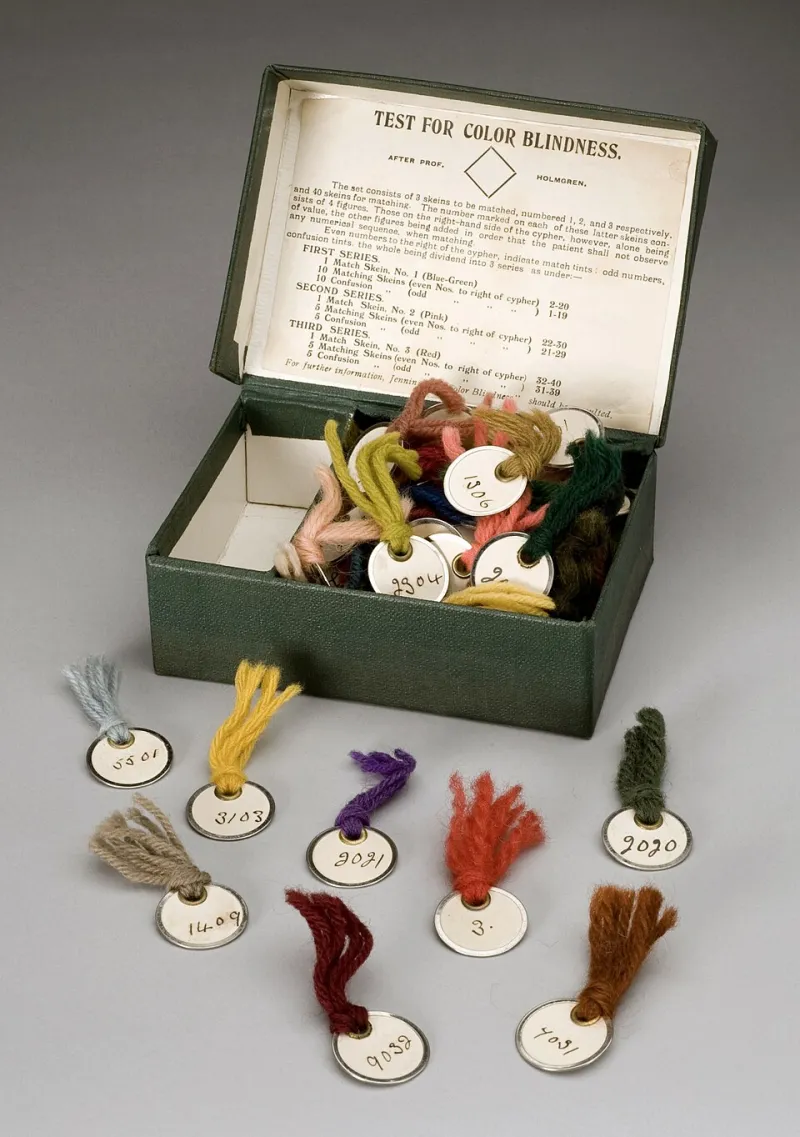
Queue boards tend to use colour as a state signal: green for available, amber for delayed, red for closed. That convention is useful only when it is paired with words and shapes. A red block alone excludes readers with colour-vision deficiency and can alarm without explaining. A red block with the word ‘closed’ and a cross icon works harder.
Public-service dashboards should treat colour as a redundant channel. Use it to reinforce a message that is already present in text, position or iconography. Test contrast rather than relying on brand palettes. Avoid red-green scales for performance bands unless a second visual cue is present. The queue board’s restraint is instructive: colour is not decoration; it is a label.
Lesson three: show the timestamp and the direction of travel
A queue board that says ‘45 minutes’ without an update time is only half a board. The same is true of a public dashboard. Readers need to know whether they are looking at data from five minutes ago or five weeks ago. A visible timestamp, a source note and a next-update line do more for trust than another chart.
Direction of travel matters too. A wait time that is rising is different from a wait time that is high but falling. A small sparkline, an arrow and a short phrase such as ‘rising since 14:00’ can carry that context without turning the display into an analytics report. The aim is not to reassure at all costs. It is to prevent a single number from being misread.
Lesson four: reduce anxiety with ranges and alternatives
Theme park boards often give an estimate rather than a false certainty. Rail screens show the next train and, where relevant, the following one. NHS waiting displays increasingly use ranges and plain-language explanations of the queue. These are anxiety-reducing design choices because they answer the reader’s next question before it is asked.
Public-service dashboards can borrow the same approach. Show a range where the data supports one. State what the reader can do next: call back, book online, check a different service, or return at a stated time. Avoid gamified language and avoid false urgency. The goal is orientation, not entertainment.
Lesson five: design for the glance and the close read
A queue board must work from a distance and close up. A public dashboard must work on a phone at a bus stop and on a desktop in a scrutiny meeting. That means responsive type, clear labels, alt text and a data table for readers who need the underlying figures. It also means testing the page at 200 per cent zoom and with a screen reader.
Accessibility is not a separate project bolted onto the visual design. It is the same discipline as the queue board: make the first reading easy, then make the second reading possible. A dashboard that cannot be read at a glance is failing its headline. A dashboard that cannot be examined in detail is failing its evidence.
Applying the lessons to public-service dashboards
A 2026 NHS trust waiting-time view might open with ‘Average wait for planned care: 14.2 weeks’, followed by ‘up 0.6 weeks since September’, a timestamp and a short note on what the trust is doing. Beneath that, a range and a link to specialty-level detail. A local authority waste dashboard might lead with ‘Missed collections this week: 1,240’, then show the trend, the main cause and the route to report a missed bin.
These are not diminished versions of the queue board. They are the queue board’s lessons applied to a more complex setting. The board does not try to tell everything. It tells the reader what to expect, how confident to be and what to do next. Public-service dashboards that adopt the same discipline will inform without overwhelming — and will be read by more people than the ones that do not.