Six Charts, One Household: Making the 2026 Budget Legible Without Distortion
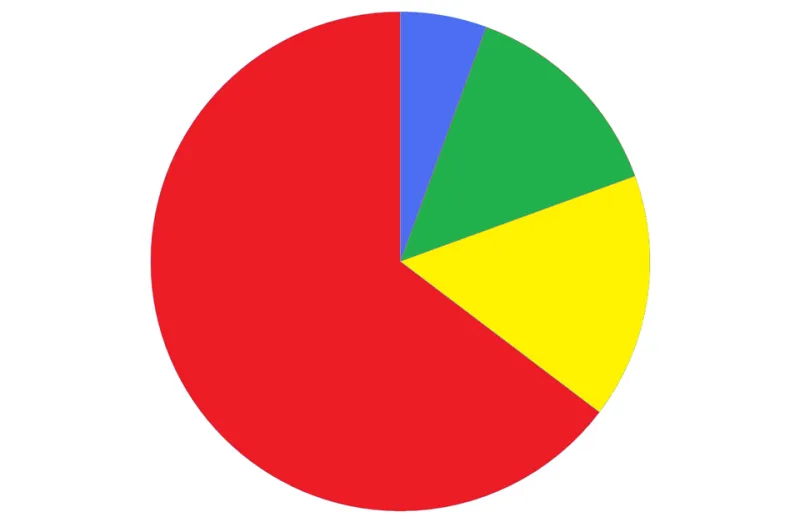
Photo: User:Anameofmyveryown, Public domain, via Wikimedia Commons
On Budget day, the numbers arrive in £ billions. A £14 billion package sounds large until a reader asks what it means for their household. The communicator's job is not to make the number smaller; it is to give it a denominator, a time frame and a clear source. The six chart forms below are designed for that task, and each can be rebuilt in a spreadsheet without specialist software.
1. Start with a denominator, not a headline total
A total without a denominator is a mood, not a measure. Per-household and per-person conversions are the quickest way to make a fiscal event feel real, but they must be labelled precisely. Divide by the number of UK households only when the policy applies across all households. Divide by adults only when the adult population is the right base. State the base year, the source and the rounding.
A simple working table is enough: total £bn, denominator in millions, result per unit, and a caveat column. For example, £10bn spread across roughly 28.4 million households is about £352 per household. That is an illustrative conversion, not a forecast of what any household will pay or receive. If the measure is targeted at a subset, such as higher-rate taxpayers, the all-household figure is misleading. Use the relevant subgroup and say so.
2. Use slopegraphs for before-and-after tax changes
Tax changes are often reported as a single number: a freeze, a rise, a threshold. A slopegraph shows the movement from the current position to the proposed position for the same taxpayer group. Two columns, one line per group, a shared axis and direct labels do most of the work. Annotate the change in cash terms and, where relevant, in real terms after applying the OBR's deflator.
A useful annotated example is a threshold freeze. In cash terms the line from the current year to the next may look almost flat. Once a CPI deflator is applied, the same line falls. Show both panels side by side rather than hiding the real-terms effect in a footnote. To rebuild it, place labels in the left column, current values in the next, proposed values in the third, and draw connecting lines on a common scale. Keep the ordering identical on both sides. Do not add a second y-axis; if two measures need different scales, use two panels.
3. Resist pie charts for departmental spending
A pie chart says that the parts make a whole, which is true of departmental spending in the aggregate. It rarely says anything useful about comparison. Small differences between slices are hard to judge, many slices become unreadable, and a large 'Other' category can dominate without explanation. Comparing two pies across years is worse: readers cannot reliably compare angles.
Use a sorted horizontal bar chart for shares of total spending. Use a stacked bar chart when the question is how composition changed over time. Use a dot plot when the question is which departments grew or fell. If a pie is unavoidable, limit it to four or five slices, group the remainder explicitly, and put absolute £bn values beside the percentages. The chart should answer a question, not decorate a press release.
4. Show cash and real terms side by side
Cash figures are what appear in the tables; real figures are what readers feel. Mixing the two in one sentence is one of the most common sources of confusion in Budget coverage. Choose a price base, state it in the subtitle, and keep it consistent across the chart. Indexed charts with a clear base year can help, but they need a note explaining what the index does and does not show.
5. Source honestly from OBR, IFS and HMRC
The OBR's Economic and Fiscal Outlook supplies the official forecast tables. The IFS provides distributional analysis and quick post-Budget commentary. HMRC publishes ready reckoners and tax statistics that are useful for checking the direction and scale of tax measures. Cite the table number, the publication vintage and the date accessed. Distinguish forecast from outturn, and do not extrapolate beyond the published table without saying that you have done so.
6. Build an annotated before-and-after panel
A two-panel figure is often the most honest format: left panel for the cash total, right panel for the per-household conversion or the real-terms change. Add a text box with the denominator, the source and the caveat. In a spreadsheet, create columns for measure, £bn, denominator and result; calculate the conversion; chart the result; add data labels; and place the source note directly under the chart rather than in a separate document.
The test is simple. Can a reader who has not read the press release explain what changed, for whom, over what period and on whose numbers? If not, the chart is not yet finished.
The craft is in the caveat
Turning £ billions into something a human being can feel does not mean pretending the numbers are precise. It means giving them a base, a comparison and a visible trail back to the source. The best Budget charts are not the loudest. They are the ones that survive a second reading.