Colour Is Not Decoration: Making UK Charts Readable for Every Eye
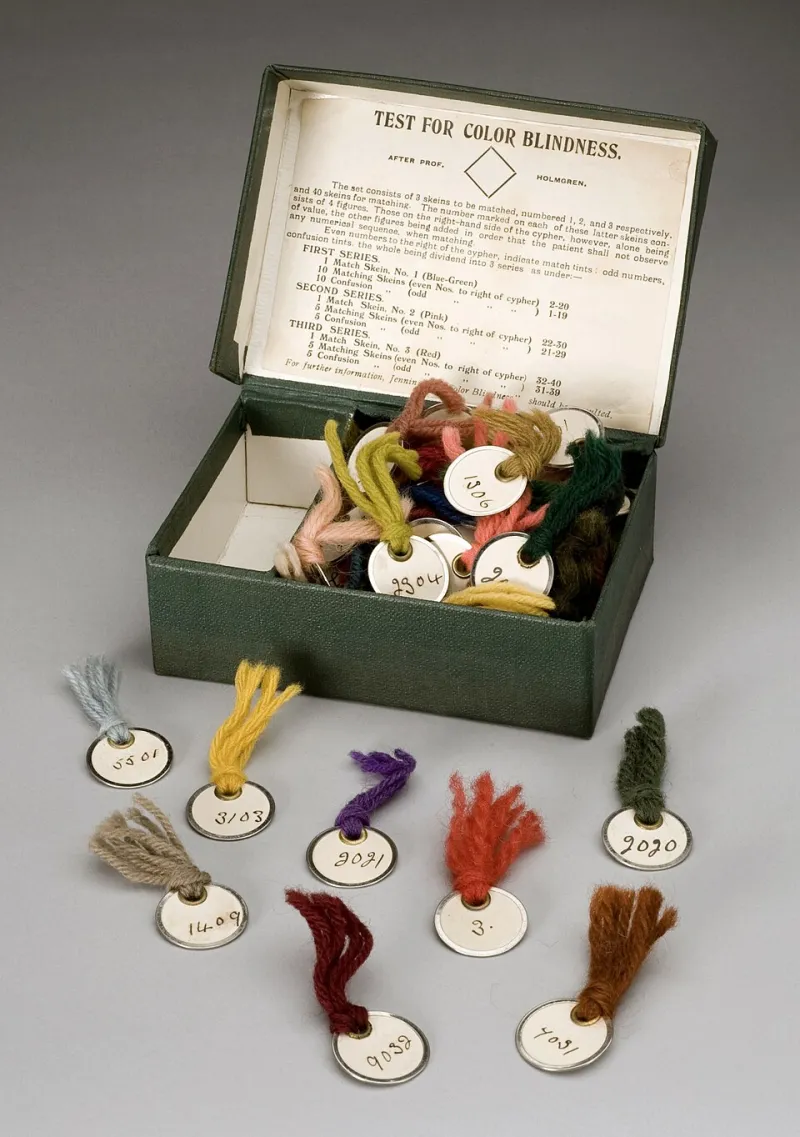
Photo: Unknown, CC BY 4.0, via Wikimedia Commons
Red and green are not opposites in the eye. For readers with deuteranopia or protanopia, the two hues can collapse into similar brownish tones. That matters because red-green heatmaps are still a default choice in UK reporting, from local authority dashboards to NHS performance summaries. The fix is not a moral lecture about colour. It is a ten-minute palette and labelling exercise that makes the chart better for everyone.
Why the rainbow scale fails so many readers
Rainbow scales are popular because they look scientific. In practice they are perceptually uneven: a bright yellow band can dominate the middle of the scale, while red and green at the ends become hard to distinguish for readers with red-green colour vision deficiency. Roughly one in twelve men and one in two hundred women of northern European descent have some form of red-green deficiency, which is a significant share of any UK audience.
A good scale has ordered lightness. A single-hue sequential palette, such as light blue to dark blue, does. A diverging palette with a neutral midpoint, such as blue to orange, does. A rainbow does not, because equal steps in the data do not produce equal steps in perceived difference.
Contrast is part of the chart, not an afterthought
The Web Content Accessibility Guidelines set a non-text contrast threshold of 3:1 for graphical objects that are needed to understand content. Text labels should meet 4.5:1. These are minimums, not targets to scrape past. Check the chart in greyscale as well as colour; if the order disappears, the palette is carrying too much weight.
The gov.uk Design System is a useful starting point for public sector communicators because it already favours accessible colour combinations and clear typography. It is not a complete chart specification, but it sets the right expectation: colour should support the message, not be the only thing that carries it. Under the Equality Act 2010, public sector organisations also have duties to make reasonable adjustments and to anticipate the needs of disabled people. An inaccessible chart is not a neutral design choice; it is a barrier in the publication itself.
The same data, rendered twice
Take a UK dataset such as recycling rates by English local authority. In the bad version, a red-green heatmap uses a rainbow scale, no direct labels and a legend that requires colour matching. A reader with protanopia sees a patchwork of similar tones. In the good version, the same data uses a light-to-dark blue sequential scale, direct labels on the highest and lowest authorities, and a short note explaining the direction of the scale. The ranking becomes visible without colour discrimination.
For change over time, use a diverging blue-orange scale rather than red-green. For categorical data, use a palette such as Okabe-Ito, which was designed with colour vision deficiency in mind. It includes orange, sky blue, bluish green, yellow, blue, vermillion, reddish purple and black. Not every combination will meet contrast requirements in every context, so test the final figure rather than trusting the palette name.
Redundancy is a feature
Colour should never be the only channel. Add direct labels to lines and bars. Use patterns or hatching in print. Use different line styles for categories. Put data values in a table beneath the chart when precision matters. Write alt text that describes the trend, not just the chart type. If the chart relies on hover tooltips, provide the same information in static text.
These choices are not decorative extras. They are what allow a reader with colour vision deficiency, low vision or a black-and-white printout to use the graphic. Redundancy also helps readers who are simply skimming on a phone.
A ten-minute fix checklist
First, replace any rainbow scale with a sequential or diverging palette that has ordered lightness. Second, add direct labels to the most important values. Third, check the figure in greyscale. Fourth, test key colours against the 3:1 non-text contrast threshold. Fifth, run the chart through a colour vision simulator. Sixth, add a source note and alt text. None of these steps requires a redesign; they require a decision to treat colour as information.
Accessibility is craft
The best UK data visualisation does not look accessible as a concession. It looks clear. A palette that survives colour vision deficiency, a label that removes guesswork and a contrast check that takes minutes are all part of the same craft: making complex information clear, one chart at a time.