Tidy Polygons, Uneven Ground: Mapping Postcode Data Without Flattening the Places Behind It
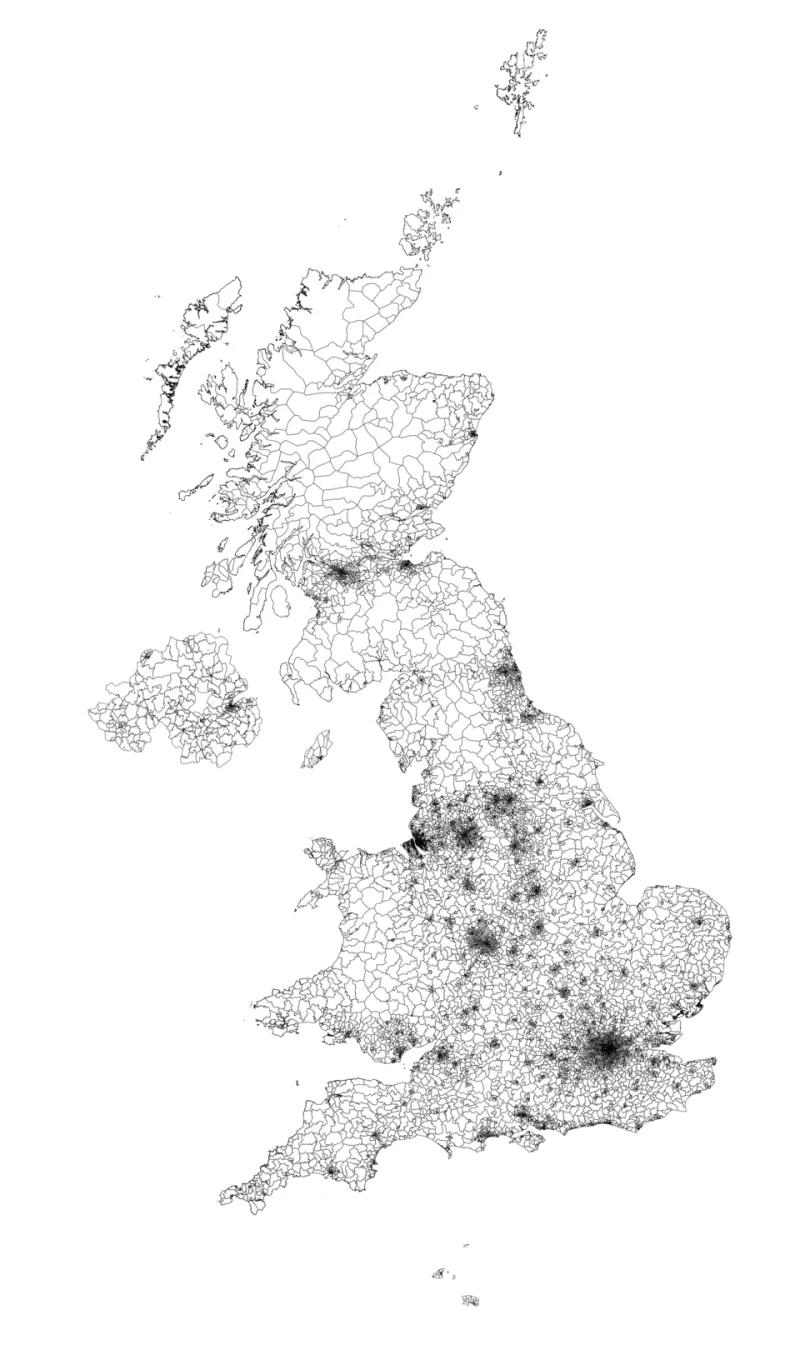
Photo: Anameofmyveryown, CC BY-SA 3.0, via Wikimedia Commons
A postcode map is seductive precisely because it looks settled. The polygons tessellate, the edges align, the colour ramp runs from pale to deep, and the whole composition suggests a place measured completely. What it does not show is that a postcode is a postal delivery route, not a neighbourhood; that its resident population may range from a few dozen to several thousand; and that the point at which a household was assigned to a polygon may have been decided by a best-fit algorithm rather than a surveyor's line.
None of this makes postcode mapping illegitimate. It makes it a craft with obligations attached.
The geography is an argument, not a backdrop
Every map of UK local data begins with a choice that few readers will ever see. Analysts can work at output area, lower-layer super output area, middle-layer super output area, ward, or postcode sector and district level, and each carries a different balance of granularity, stability and disclosure risk. Postcode sectors group addresses by their outward and first inward character; districts stop one step earlier. Both are convenient for operational data because services are often organised that way. Neither was built for statistical release.
The consequence is a familiar mismatch. A dashboard of local service uptake, drawn at postcode district level, may look authoritative and yet be unable to distinguish two streets that sit on opposite sides of a commissioning boundary. Where the underlying data were collected by postcode and converted using a best-fit lookup, each record inherits a small, silent uncertainty that no legend will disclose.
Three distortions that recur
Area is not population. Large, sparsely populated polygons command more ink than dense urban ones. A rural district covering hundreds of square kilometres may hold fewer residents than a single city sector. Without normalisation, the map reports land, not people.
The average conceals the spread. Postcode-level indicators frequently hide internal variation of a magnitude that would change the reader's conclusion. A mean taken across a district that includes both affluent and deprived neighbourhoods produces a number that describes no one.
Boundaries do not match the question. Service catchments, clinical commissioning footprints, school admissions areas and police beats seldom correspond to postcode geography. A map that overlays them without comment invites the reader to infer a relationship that the data do not support.
Choosing a geography you can defend
Where the analytical question concerns people rather than post, statistical geographies built from census output areas are usually the better instrument, and lookups between postcode and output area are published and versioned. Where postcode geography is unavoidable — because the source system records nothing finer — the map should be accompanied by three pieces of information in the frame itself, not in a footnote: the postcode unit used, the lookup vintage, and whether the assignment was best-fit or exact.
Small counts require suppression. A postcode sector with a denominator in the low tens will produce percentages that swing wildly between periods for reasons that have nothing to do with the place. Setting a minimum threshold and stating it is not a technical nicety; it is the difference between a chart and a rumour.
Annotation is part of the graphic
A well-built map carries its caveats inside the composition. In practice this means:
- A title that states the finding rather than naming the dataset.
- A subtitle giving the denominator, the period and the geography level.
- A visible note on the source, the release date and any conversion applied.
- A direct statement where areas have been suppressed or where the colour ramp is not linear.
Readers who scan a graphic for four seconds will absorb the title and the shape. Anything essential that lives in a download link has effectively been withheld.
Alternatives worth testing
Choropleths are not the only option, and often not the best. A cartogram rescales each area by population and immediately exposes the difference between land and people. A hex or grid layout imposes uniform cells and removes the accident of polygon size. Dot density can show clustering without implying that an entire district shares a characteristic. Small multiples at two time points will often communicate change more honestly than a single map with a diverging ramp.
Where the postcode layer must stay, consider showing the building blocks. A district-level average is more defensible when the underlying sectors are visible beneath it, even at low contrast, because the reader can see that the average is an average.
A checklist for analysts and communicators
Before publication, confirm each of the following: the geography level and its purpose; the population denominator behind every rate; the suppression threshold and where it bites; the vintage of both the boundary file and the lookup; whether the boundary file and the data refer to the same year; whether any area has been reclassified or abolished since the data were collected; and whether a colleague unfamiliar with the dataset can state, from the graphic alone, what is being counted and over what period.
Finally, test the map with someone who lives in the area it depicts. They will notice at once whether the shading matches their experience of the place. That reaction is the most useful quality check available, and it costs a conversation rather than a licence.
The postcode is a routing device. The place is something else. A good map keeps the two in view at once, and says plainly which one it is measuring.