Beyond the Blue Line: Designing Flood Risk Graphics That Show Range, Depth and Doubt
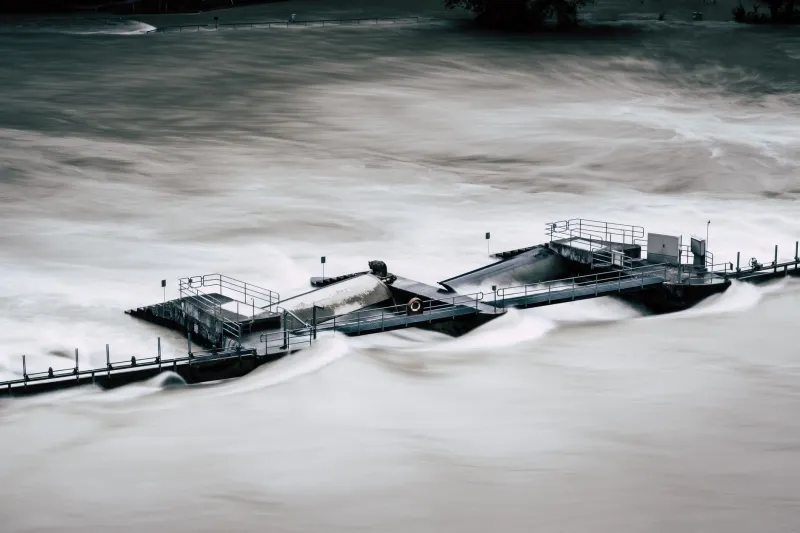
Every week, somewhere in the UK, a property transaction slows because a conveyancer has opened a flood map and found a blue shape sitting over a postcode. The map is doing precisely what it was built to do. What it is not doing, and what few of its users realise, is distinguishing between a probability, a scenario and a prediction. For anyone who designs environmental graphics, that gap is the whole job.
The Environment Agency's flood map for planning, its Scottish and Welsh equivalents from SEPA and Natural Resources Wales, and the surface water maps that sit alongside them are consulted by householders, surveyors, lenders, journalists and planning officers. A shading on a screen can shift an insurance quote, prompt a planning objection or end a sale. Given that weight, the visual grammar these maps use deserves more scrutiny than it usually receives.
A rate, not a rota
The phrase 'one-in-100-year flood' is the most consequential piece of shorthand in British environmental communication, and it is quietly misleading. It describes a 1% annual exceedance probability: in any single year there is a one per cent chance that river flows at a given point will exceed a defined threshold. Two such events can occur in consecutive winters and then not again for a century and a half. Nothing in the phrase prevents that, but everything in the phrase suggests otherwise. Readers hear a rota; hydrologists mean a rate.
The same confusion attaches to the 0.1% event, routinely rendered as 'one in 1,000 years'. A graphics team cannot fix the underlying statistics, but it can choose whether the graphic reinforces the misreading or corrects it. A legend that says '1% chance in any year' alongside the conventional label costs nothing and removes an entire category of misunderstanding.
The trouble with a crisp edge
Flood Zone 2 and Flood Zone 3 are the workhorses of English planning. They are also binary, and binaries demand edges. The boundary of the blue is the boundary of a modelled extent for a specified scenario, generated from a hydraulic model whose grid resolution is coarser than the one-metre lidar that feeds it. Beyond that line the map shows white, and white reads as safe.
In practice, white often means 'outside the modelled extent for this scenario'. It can also mean 'not modelled', 'ordinary watercourse', 'surface water', 'sewer flooding' or 'groundwater'. The written caveats say so. The graphic does not. A householder looking at a white patch does not go on to read the caveats; they go on to make a decision.
The same problem appears in surface water mapping, where high, medium and low risk bands are drawn with the same confident edges. Groundwater flooding, which is slow, deep and notoriously poorly mapped, tends to vanish entirely because it does not fit the fluvial model at all.
Colour is carrying too much weight
Deep blue for water, white for safety: the convention is intuitive and therefore almost invisible to the people who choose it. But a sequential blue ramp applied to what are really categorical risk bands implies an ordinal scale that the data does not support, and it hard-codes water as the only hazard while leaving emptiness to mean protection.
A more defensible palette separates likelihood from consequence. Likelihood can be shown as bands or patterns; consequence can be shown as a separate layer, ideally in a distinct hue. Areas outside the model should be hatched or textured, not left white, so that 'unknown' never masquerades as 'fine'.
Four variables the graphic should carry
Most flood maps communicate extent and nothing else. Extent is the least useful single variable for anyone trying to judge what a flood would actually do. A practical alternative carries four dimensions:
| Variable | What it answers | How to show it |
|---|---|---|
| Depth | How deep will the water be? | Banded depth categories (under 0.3 m, 0.3-1 m, over 1 m) with plain-English labels |
| Velocity and hazard | Could I walk or drive through it? | A hazard rating derived from depth multiplied by velocity, shown as its own layer |
| Timing | How much warning would I get? | Lead time bands distinguishing fast-responding surface water from slower river catchments |
| Duration | How long would it stay? | Residence time shading, especially valuable for farmland and ground floors |
None of these requires new science. Most of the data already exists inside the models that produce the extents; it simply is not surfaced.
Making room for doubt
Uncertainty is not an admission of weakness in a public graphic; it is the accurate representation of what is known. Three techniques are worth adopting as standard.
First, banded edges. Instead of a single hard boundary, show a transition zone where the model is genuinely less reliable, and say so in the legend.
Second, climate scenarios as small multiples. A map showing present-day 1% extent beside the same extent under a 2050s central allowance, and again under a higher allowance, communicates adaptation risk far better than a single panel with a footnote. The Environment Agency publishes allowances precisely so that this comparison can be drawn.
Third, visible provenance. A data vintage line, a named scenario and a model version in the corner of the map do more for public trust than any amount of explanatory copy, because they signal that the picture is a calculation rather than a photograph.
A redesign checklist
For teams producing flood graphics, whether in a local authority, an insurer, a consultancy or a newsroom:
- State the scenario on the map face, not in the accompanying text.
- Label likelihood in plain words as well as technical codes.
- Replace white outside the extent with an explicit 'not modelled or not shown' hatch.
- Add depth and, where available, hazard layers as toggles rather than fixed ink.
- Show at least one climate scenario alongside the present day.
- Keep the legend to a single sentence per class, written for a householder rather than a hydrologist.
- Pair every map with one sentence of probability: what the percentage means, and what it does not mean.
Precision is not accuracy
A map drawn to a one-metre line looks authoritative. That is the problem. The hydrological and hydraulic work behind a UK flood map is genuinely rigorous, but its output is a range of plausible futures, not a boundary on the ground. Graphics that hide the range in order to look decisive do a disservice to the science they represent. Graphics that show the range, the depth, the timing and the doubt give readers something better than reassurance: they give them the ability to judge.