The Stranger at the Stop: Bus Diagrams That Answer Whether You Can Get There From Here
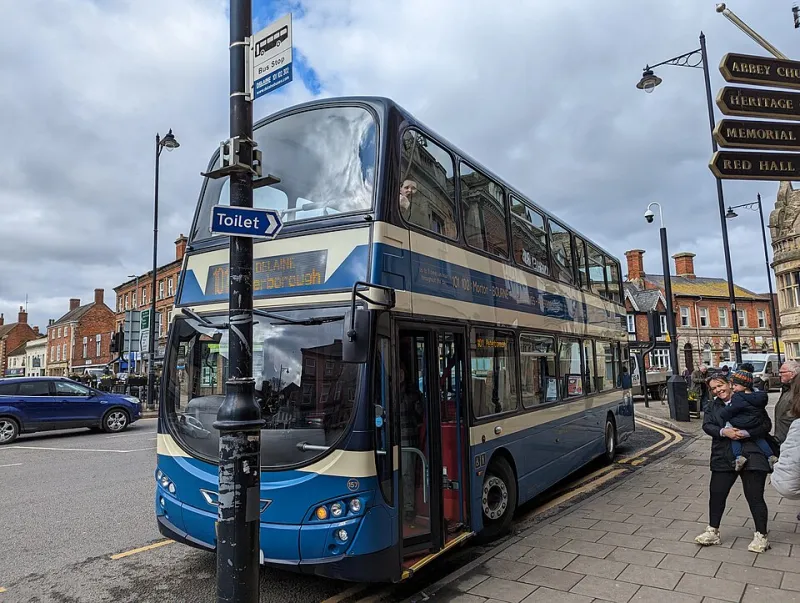
Photo: Bob Harvey, CC BY-SA 2.0, via Wikimedia Commons
Picture a visitor stepping off a train in an unfamiliar English town. They need to reach a hospital two miles away, they have a heavy bag and it is beginning to rain. The panel in front of them, if there is one, is almost certainly organised by route number, with a list of destinations in small type and a schematic that assumes a working knowledge of the local network. The diagram is not wrong. It is simply answering a question nobody at that stop is asking.
The question comes first
A regular passenger wants to know when their usual bus is due. A stranger wants to know one thing: can I get from here to where I need to be, now, without a change I cannot manage? Those are different questions, and they need different graphics. Most UK bus information is designed for the first and merely tolerated by the second.
The consequence is predictable. The stranger asks the driver, and the driver, who is not paid to be an information service, gives a shorthand answer that may or may not be right. Every diagram that fails to answer the question at a glance converts a piece of visual communication into a conversation that the network cannot afford.
What the spider map gets right
London's spider maps remain the strongest widely deployed example of passenger-centred bus cartography. Their central move is simple and decisive: the node represents where the reader is standing, and everything radiates outward from that point. Geography is straightened, alignments are schematic and the destination names sit at the end of each line. The lineage runs back to Harry Beck's tube diagram, but the useful innovation is not the geometry — it is the orientation around the reader.
Where the format strains is in reproduction. A spider map designed for a panel at a bus station becomes almost unreadable when shrunk to a leaflet, and the small type that carries the destination detail is the first thing to disappear. The second strain is currency: a diagram that requires a designer's attention to update will drift out of date in a franchised or tendered network where service changes come in batches.
Frequency belongs on the line
A route line of uniform weight says nothing about how useful the route is. Ten buses an hour and one bus an hour are drawn identically on far too many regional leaflets, leaving the reader to hunt for a timetable column that may be on the other side of the paper.
Line weight can carry frequency, but only if the relationship is explicit and the legend is close by. A clearer approach uses named bands — 'every 5 to 8 minutes', 'every 12 minutes', 'hourly' — applied as a small set of line styles rather than a continuous scale. Three styles can be distinguished on a phone; six cannot.
Time of day matters as much as day of week. A route that runs every ten minutes until early evening and then hourly is, for planning purposes, two different routes. Diagrams that show only the daytime pattern flatter the network and mislead the passenger who is travelling after seven.
After dark, the diagram disappears
Night services are the Cinderella of bus graphics. They exist, they are often sparse, and they are usually invisible on the panel at the stop. Yet for shift workers, hospital staff and anyone arriving on a late train, the last bus is the single most important number on the poster.
A simple improvement is to print the time of the last service towards each destination directly on the diagram, rather than relying on a separate timetable index. Where the night network differs, show it as a distinct layer rather than a footnote. On a phone, that layer can be a toggle; on a shelter, a small inset.
A change is a cost, not a node
Schematic diagrams treat interchange as a point where lines meet, which is geometrically tidy and practically inadequate. What the passenger needs to know is how far they must walk, whether the change is at the same stop or a different one, and whether the whole journey is step-free.
Annotating interchanges with walking time and a step-free symbol turns a diagram into a plan. In areas where franchising has brought route networks under unified branding — Greater Manchester's Bee Network being the most visible recent example — there is a particular opportunity, because one organisation now controls both the data and the diagram.
Accessibility is structural, not a footnote
The Equality Act 2010 and the Public Service Vehicles Accessibility Regulations set a floor for vehicles; the graphic has its own obligations. Route identity should never rely on colour alone, since a red route and a green route are the same route to a reader with deuteranopia. Contrast ratios should meet WCAG 2.2 at 4.5:1 for body text, and type on a shelter poster needs to be sized for a viewing distance of two to three metres, not for a desk.
The availability of open timetable data through the Bus Open Data Service means these diagrams no longer have to be hand-drawn one at a time. Automated generation, though, only helps if the templates are designed around the passenger's question rather than around the operator's database schema.
A checklist for testing bus graphics
Before a diagram goes to print or to screen, test it against the following conditions:
- Arm's length, in sunlight. View the phone version outdoors at midday with the screen at reduced brightness. If the frequency bands vanish, they are too subtle.
- Shelter distance. Stand two to three metres from the printed panel in flat light and identify the next bus to a named destination without moving closer.
- Poor light. Repeat the shelter test after dusk, checking whether reflective or backlit panels hold up and whether the legend remains legible.
- The stranger test. Give the diagram to someone who does not know the area and ask them to plan a journey involving one change. Watch where their eye goes; it will not go where you expect.
- The low-vision test. Check contrast, minimum type size and whether route numbers are distinguishable without colour.
- The change test. Ask a wheelchair user to plan a journey with an interchange. If the diagram cannot answer whether the change is step-free, it has failed.
- The offline test. Confirm the phone version works without a signal, since shelters are frequently in exactly the places where coverage is poor.
- The last bus test. Ask what time the final service runs towards each destination. If the answer requires a second document, the diagram is incomplete.
From network to journey
The best bus diagrams stop describing a network and start answering a question. That shift costs designers very little — a reorientation of the central node, an honest line weight, a last-bus time in the corner — and it returns a great deal to the person standing in the rain with a bag, deciding whether to wait or to walk.